In this post, explore what observability and monitoring systems, the patterns of a good observability platform, and the observability subsystem may look like.
In the past few years, the complexity of systems architectures drastically increased, especially in distributed, microservices-based architectures. It is extremely hard and, in most cases, inefficient to debug and watch logs, particularly when we have hundreds or even thousands of microservices or modules. In this article, I will describe what observability and monitoring systems, the patterns of a good observability platform, and the observability subsystem may look like.
This is an article from DZone’s 2022 Performance and Site Reliability Trend Report. For more: Read the Report
Observability vs. Monitoring
Before we jump directly to the point, let’s describe what observability is, what components it includes, and how it differs from monitoring. Observability allows us to have a clear overview of what happens in the system without knowing the details or domain model. Moreover, observability lets us efficiently provide information about:
- The overall system, separate service failures, and outages
- The behavior of the general system and services
- The overall security and alerts
We know what functions should cover the observability system. Below we can see what information should be gathered to properly design an observability and monitoring platform.
-
Metrics Data collection allows us to understand the application and infrastructure states for example, latency and the usage of CPU, memory, and storage.
-
Distributed traces Allows us to investigate the event or issue flow from one service to another
-
Logs This is a message with a timestamp that contains information about application- or service-level errors, exceptions, and information.
-
Alerting When an outage occurs or something goes wrong with one or several services, alerts notify these problems via emails, SMS, chats, or calls to operators. This allows for quick action to fix the issue.
-
Availability Ensures that all services are up and running. The monitoring platform sends prob messages to some service or component (to the HTTP API endpoint) to check if it responds. If not, then the observability system generates an alert (see the bullet point for alerting).
Also, some observability and monitoring platforms may include user experience monitoring, such as heat maps and user action recording.
Observability and monitoring follow the same principles and patterns and rely primarily on toolsets, so in my opinion, the differentiation between the two is made for marketing purposes. There is no clear definition of how observability differs from monitoring; all definitions are different and high-level.
Observability Patterns
All complex systems based on microservices have recommendations and patterns. This allows us to build a reliable system without reinventing the wheel. Observability systems also have some essential patterns. The following sections discuss five of the most important patterns.
Log Aggregation Pattern
In distributed systems, logging can be difficult. Each microservice can produce a lot of logs, and it can be a nightmare to find and analyze errors or other log messages of each microservice. Therefore, the log aggregation pattern helps us here. It contains the central log aggregation service as a central log storage. Also, the service provides options to label, index, categorize, search, and analyze all logs. There are a few examples of log aggregation platforms like Grafana Loki, Splunk, Fluentd, and the ELK stack.
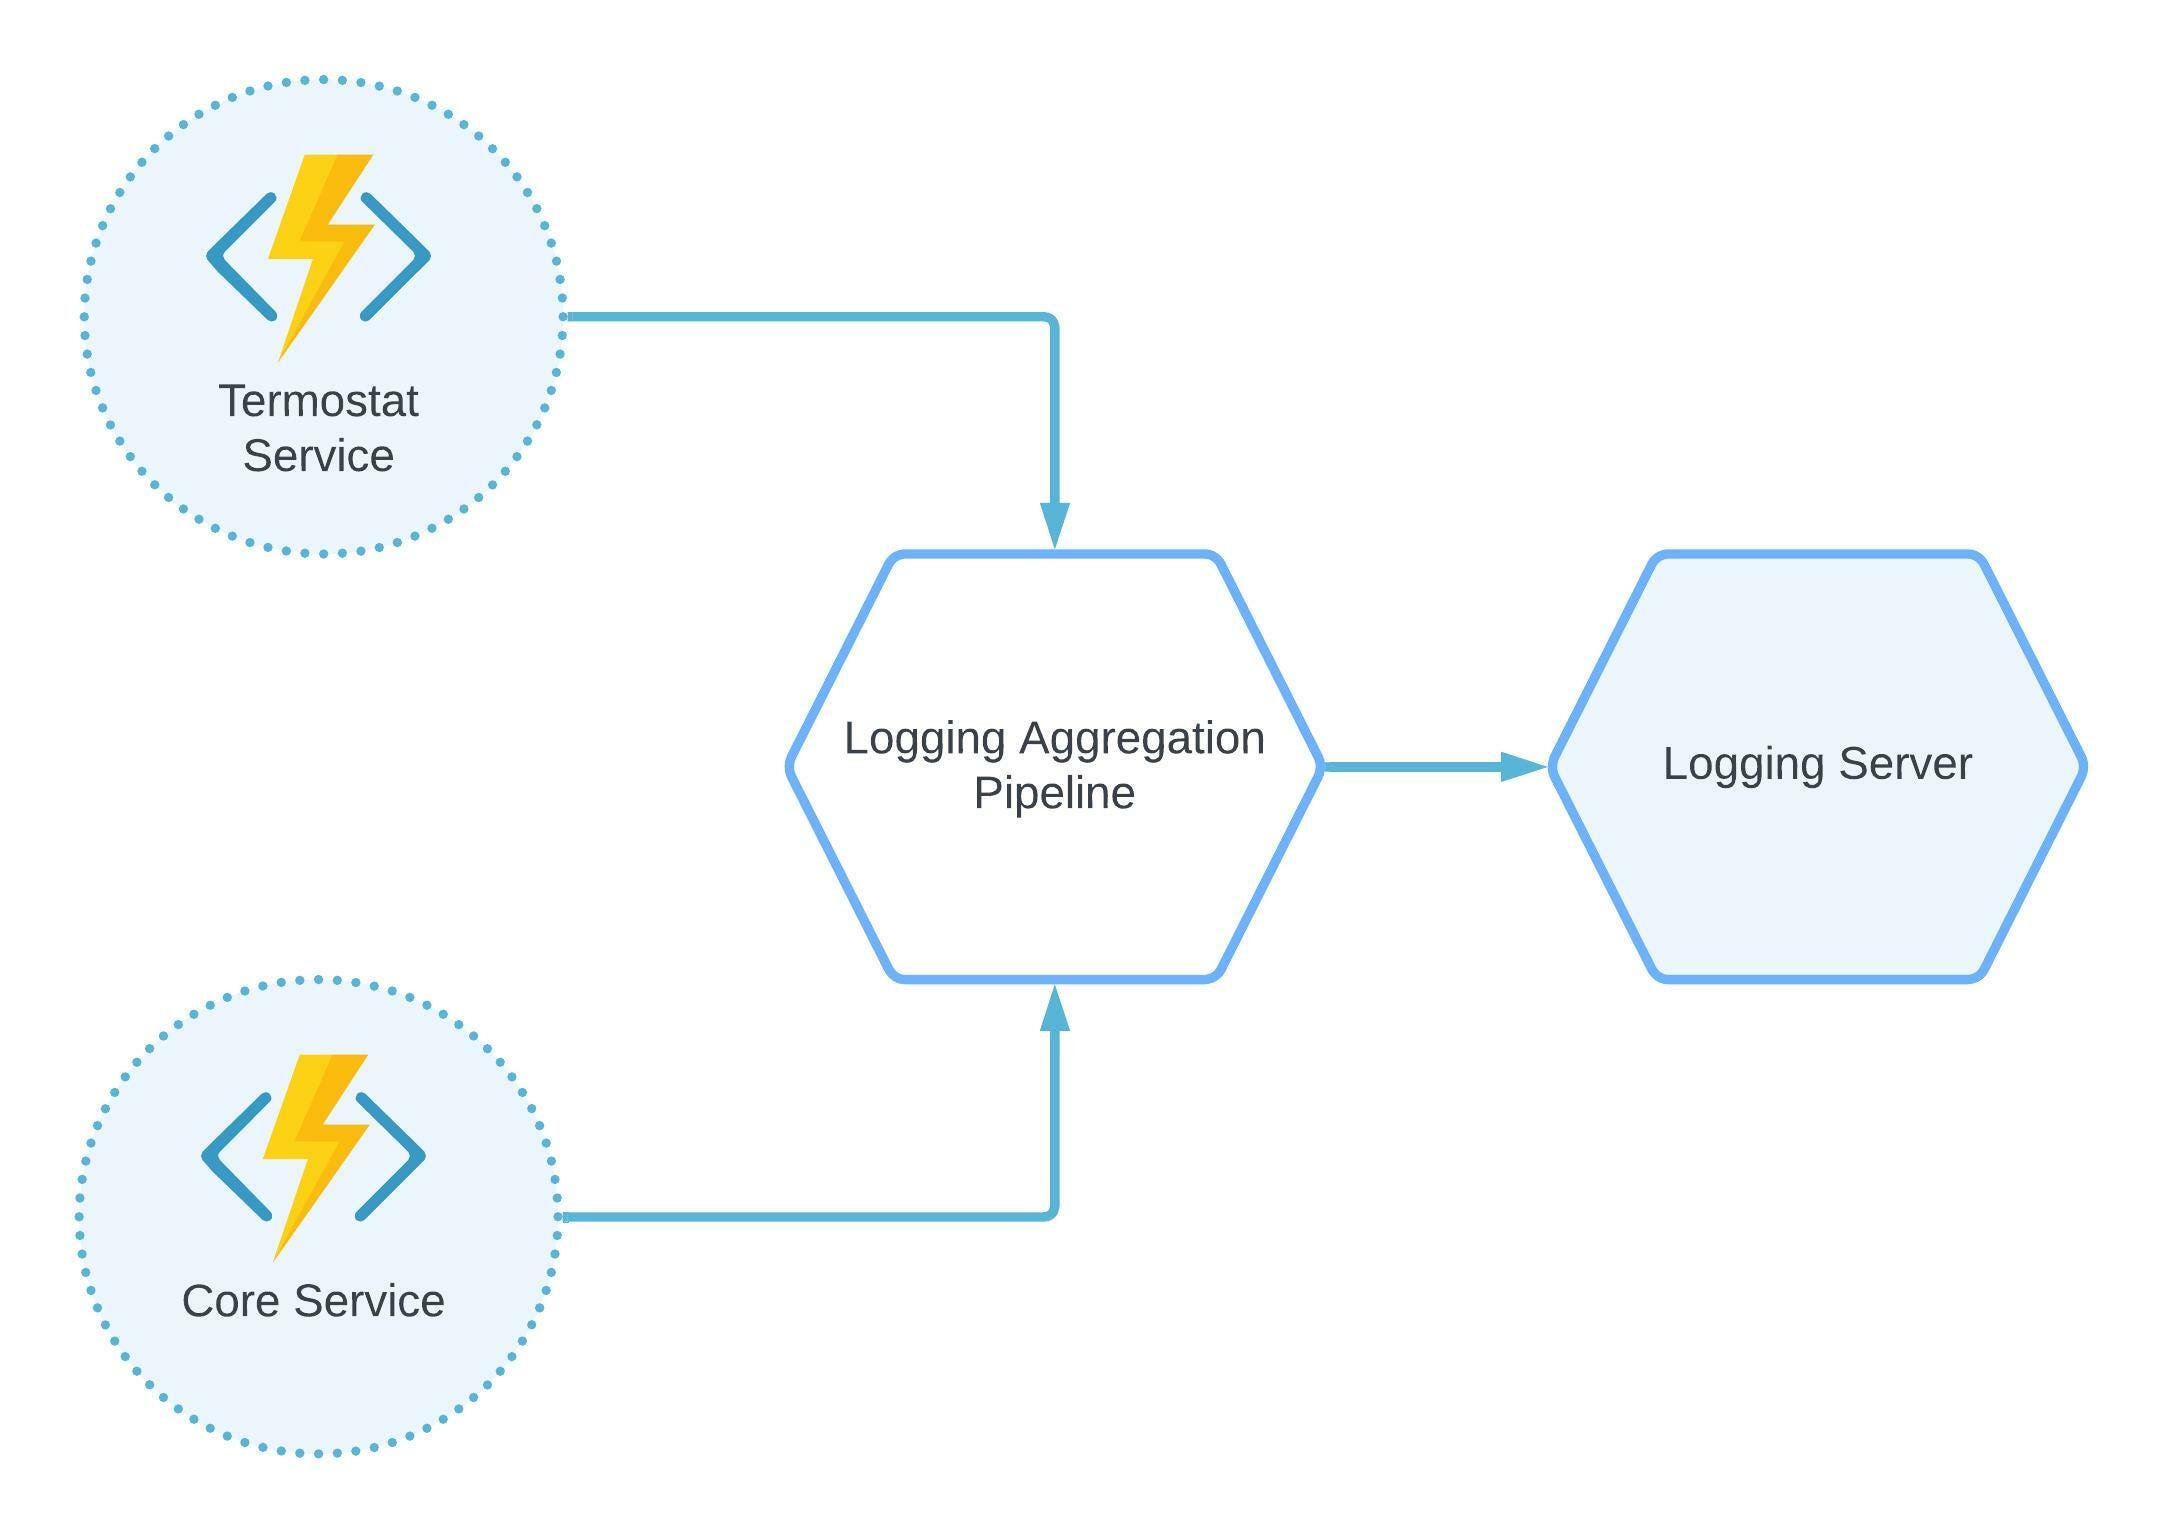
Figure 1: Log aggregation pattern
Health Check Pattern
Imagine you have multiple services or microservices, and you need to know their current state. Of course, you can go to the logging aggregation service and check logs. But services may not produce logs in a starting state. Also, it may be the case where logging in is unavailable when the services fail.
In all these instances, you need to implement health check patterns. You just need to create a health (or ping) endpoint in your service and point your log aggregation system to check and collect the checks of each service. You can also set up notifications or alerting when the service is unavailable ‘ it saves a lot of time recognizing what service failed to start or went down.
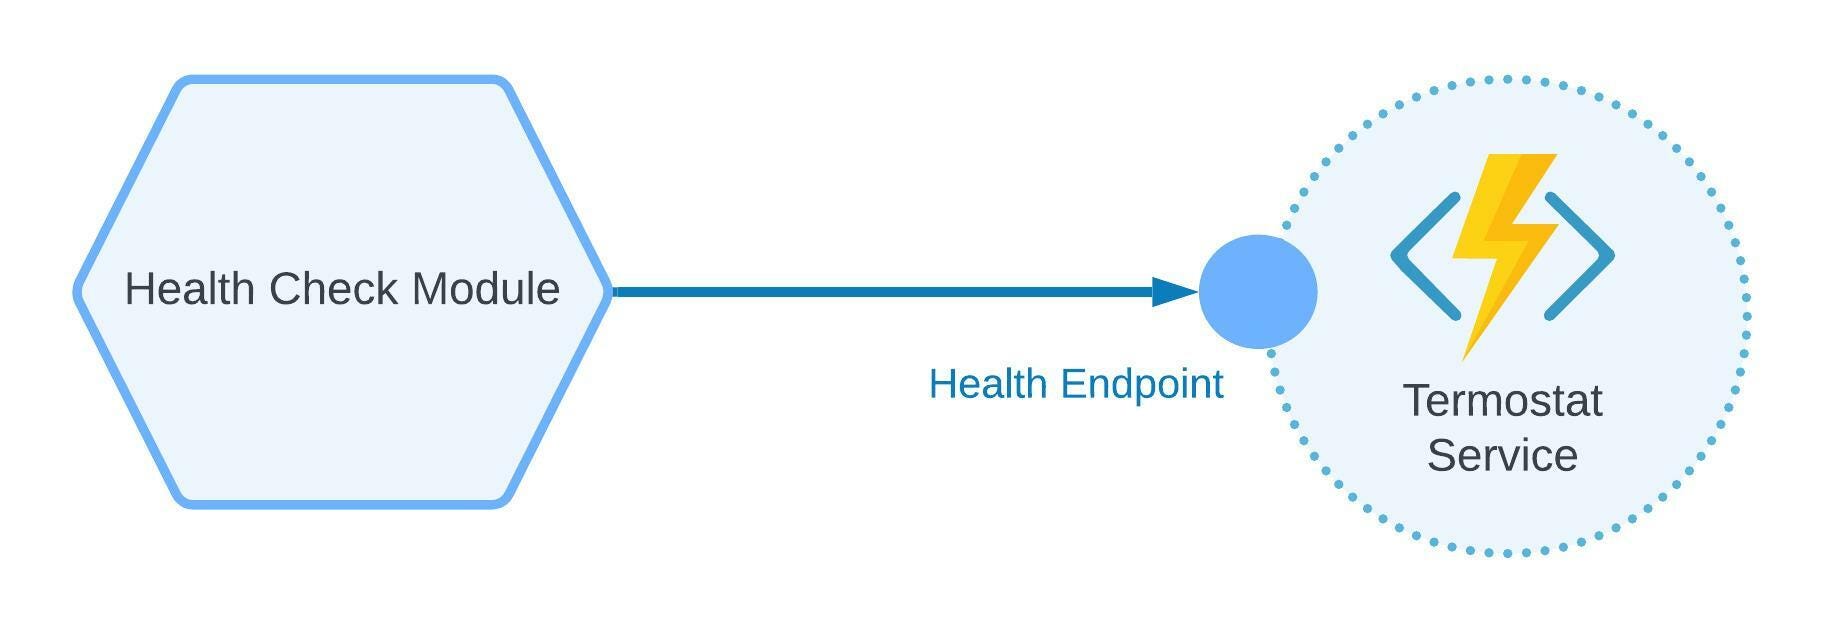
Figure 2: Health check pattern
Distributed Tracing Pattern
Imagine this scenario: you have multiple components, modules, and libraries in one or several microservices. You need to check the whole history of component execution or send the request to one microservice, and you need to check the execution history from one service component list to another.
To do this, you need to have some distributed system that will collect and analyze all tracing data. Some open-source services allow you to do so, such as Jaeger, OpenTelemetry, and OpenCensus. Check out the Istio documentation for an example that demonstrates distributed tracing in action.
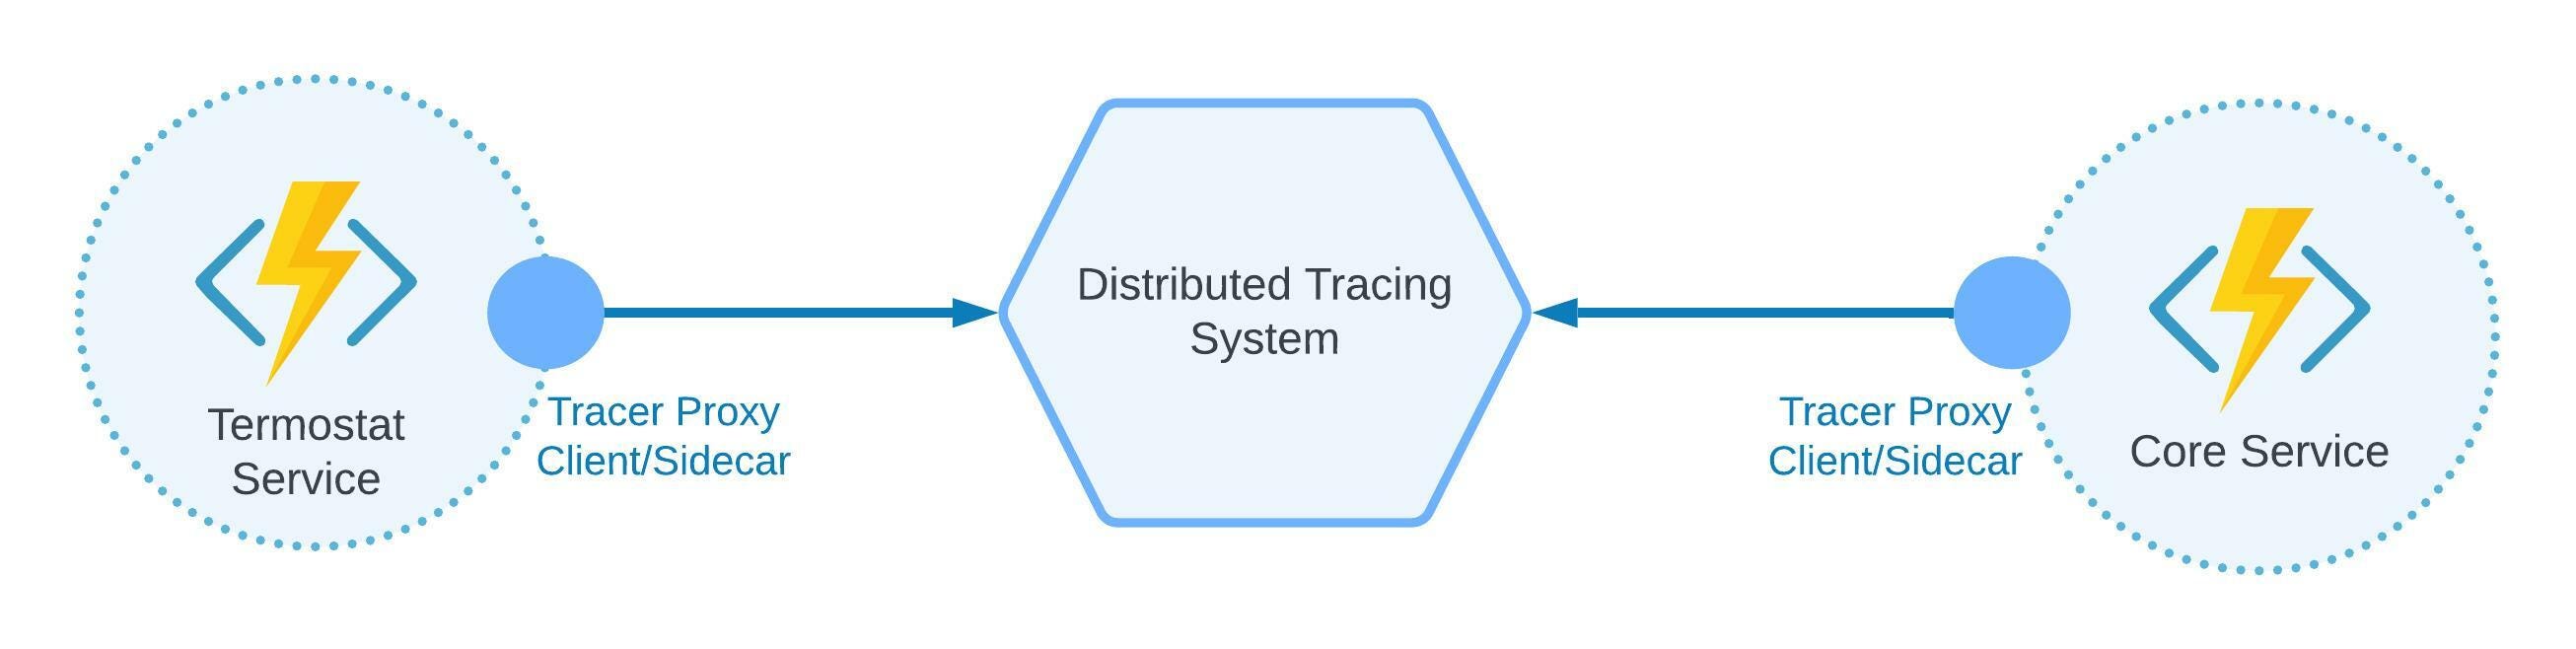
Figure 3: Distributed tracing pattern
Application Metrics Pattern
Having distributed logging and tracing is essential; however, without application metrics, your observability system will not be complete. You may need to collect infra- and application-level metrics, such as:
- CPU
- Memory
- Disc use
- Services requests/response time
- Latency
Collecting these metrics will not only help you understand what infrastructure size you need but will also help you save money on cloud providers. It also helps you to quickly mitigate outages caused by a lack of CPU or memory resources.
Below is an example of the service that has a proxy agent. The proxy agent aggregates and sends telemetry data to the observability platform.
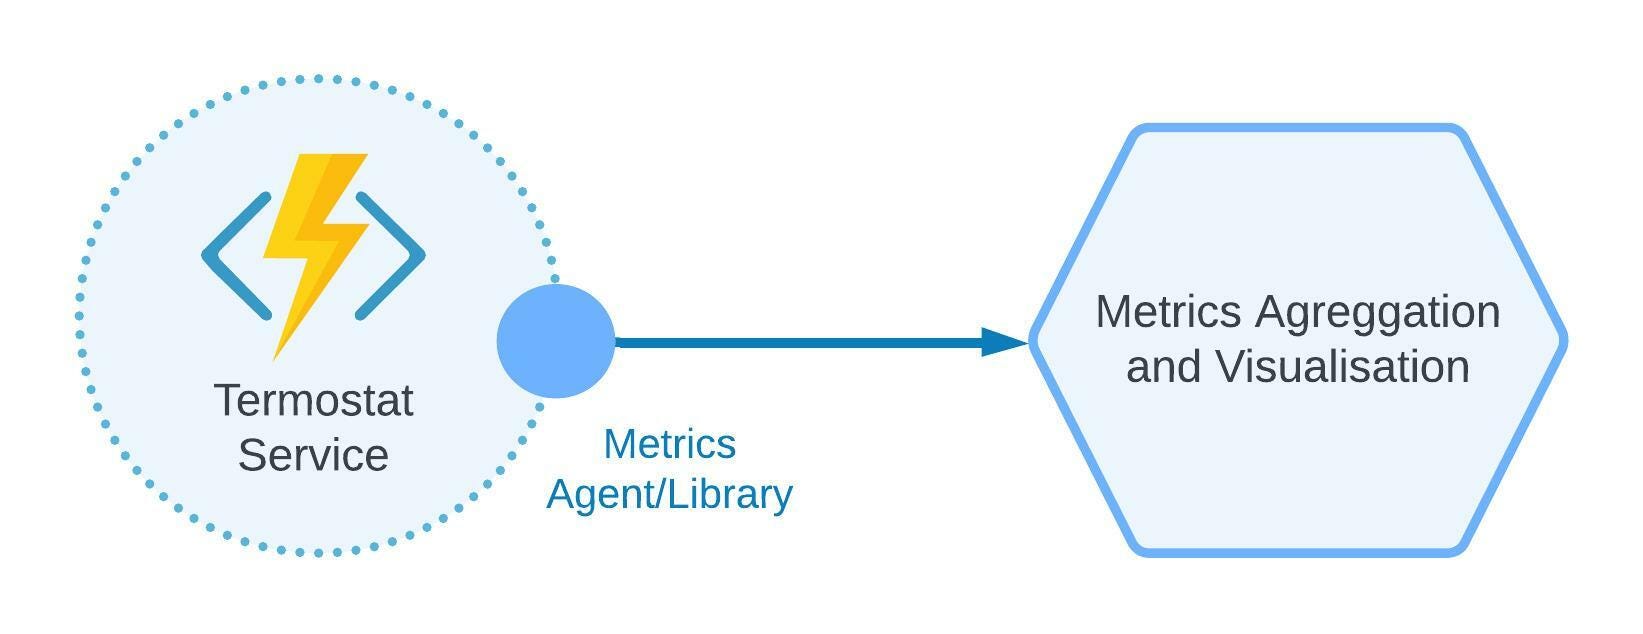
Figure 4: Application metrics pattern
Service Mesh for Observability
A service mesh not only provides a central management control plane for microservices architecture but also provides a single observability subsystem.
Instead of installing a separate tool for gathering metrics, distributed traces, and logs, we can just use one. For example, Azure provides an integrated service mesh add-on that can be set up in a minute.
There is also an option to use Istio service mesh, which contains all features required for a proper observability subsystem. Moreover, it can gather metrics, logs, and traces for the control plane.
For example, when we set up Grafana, Loki, or other tools, we also need to enable observability for them, as they may also fail while working or during the deployment process; therefore, we need to troubleshoot.
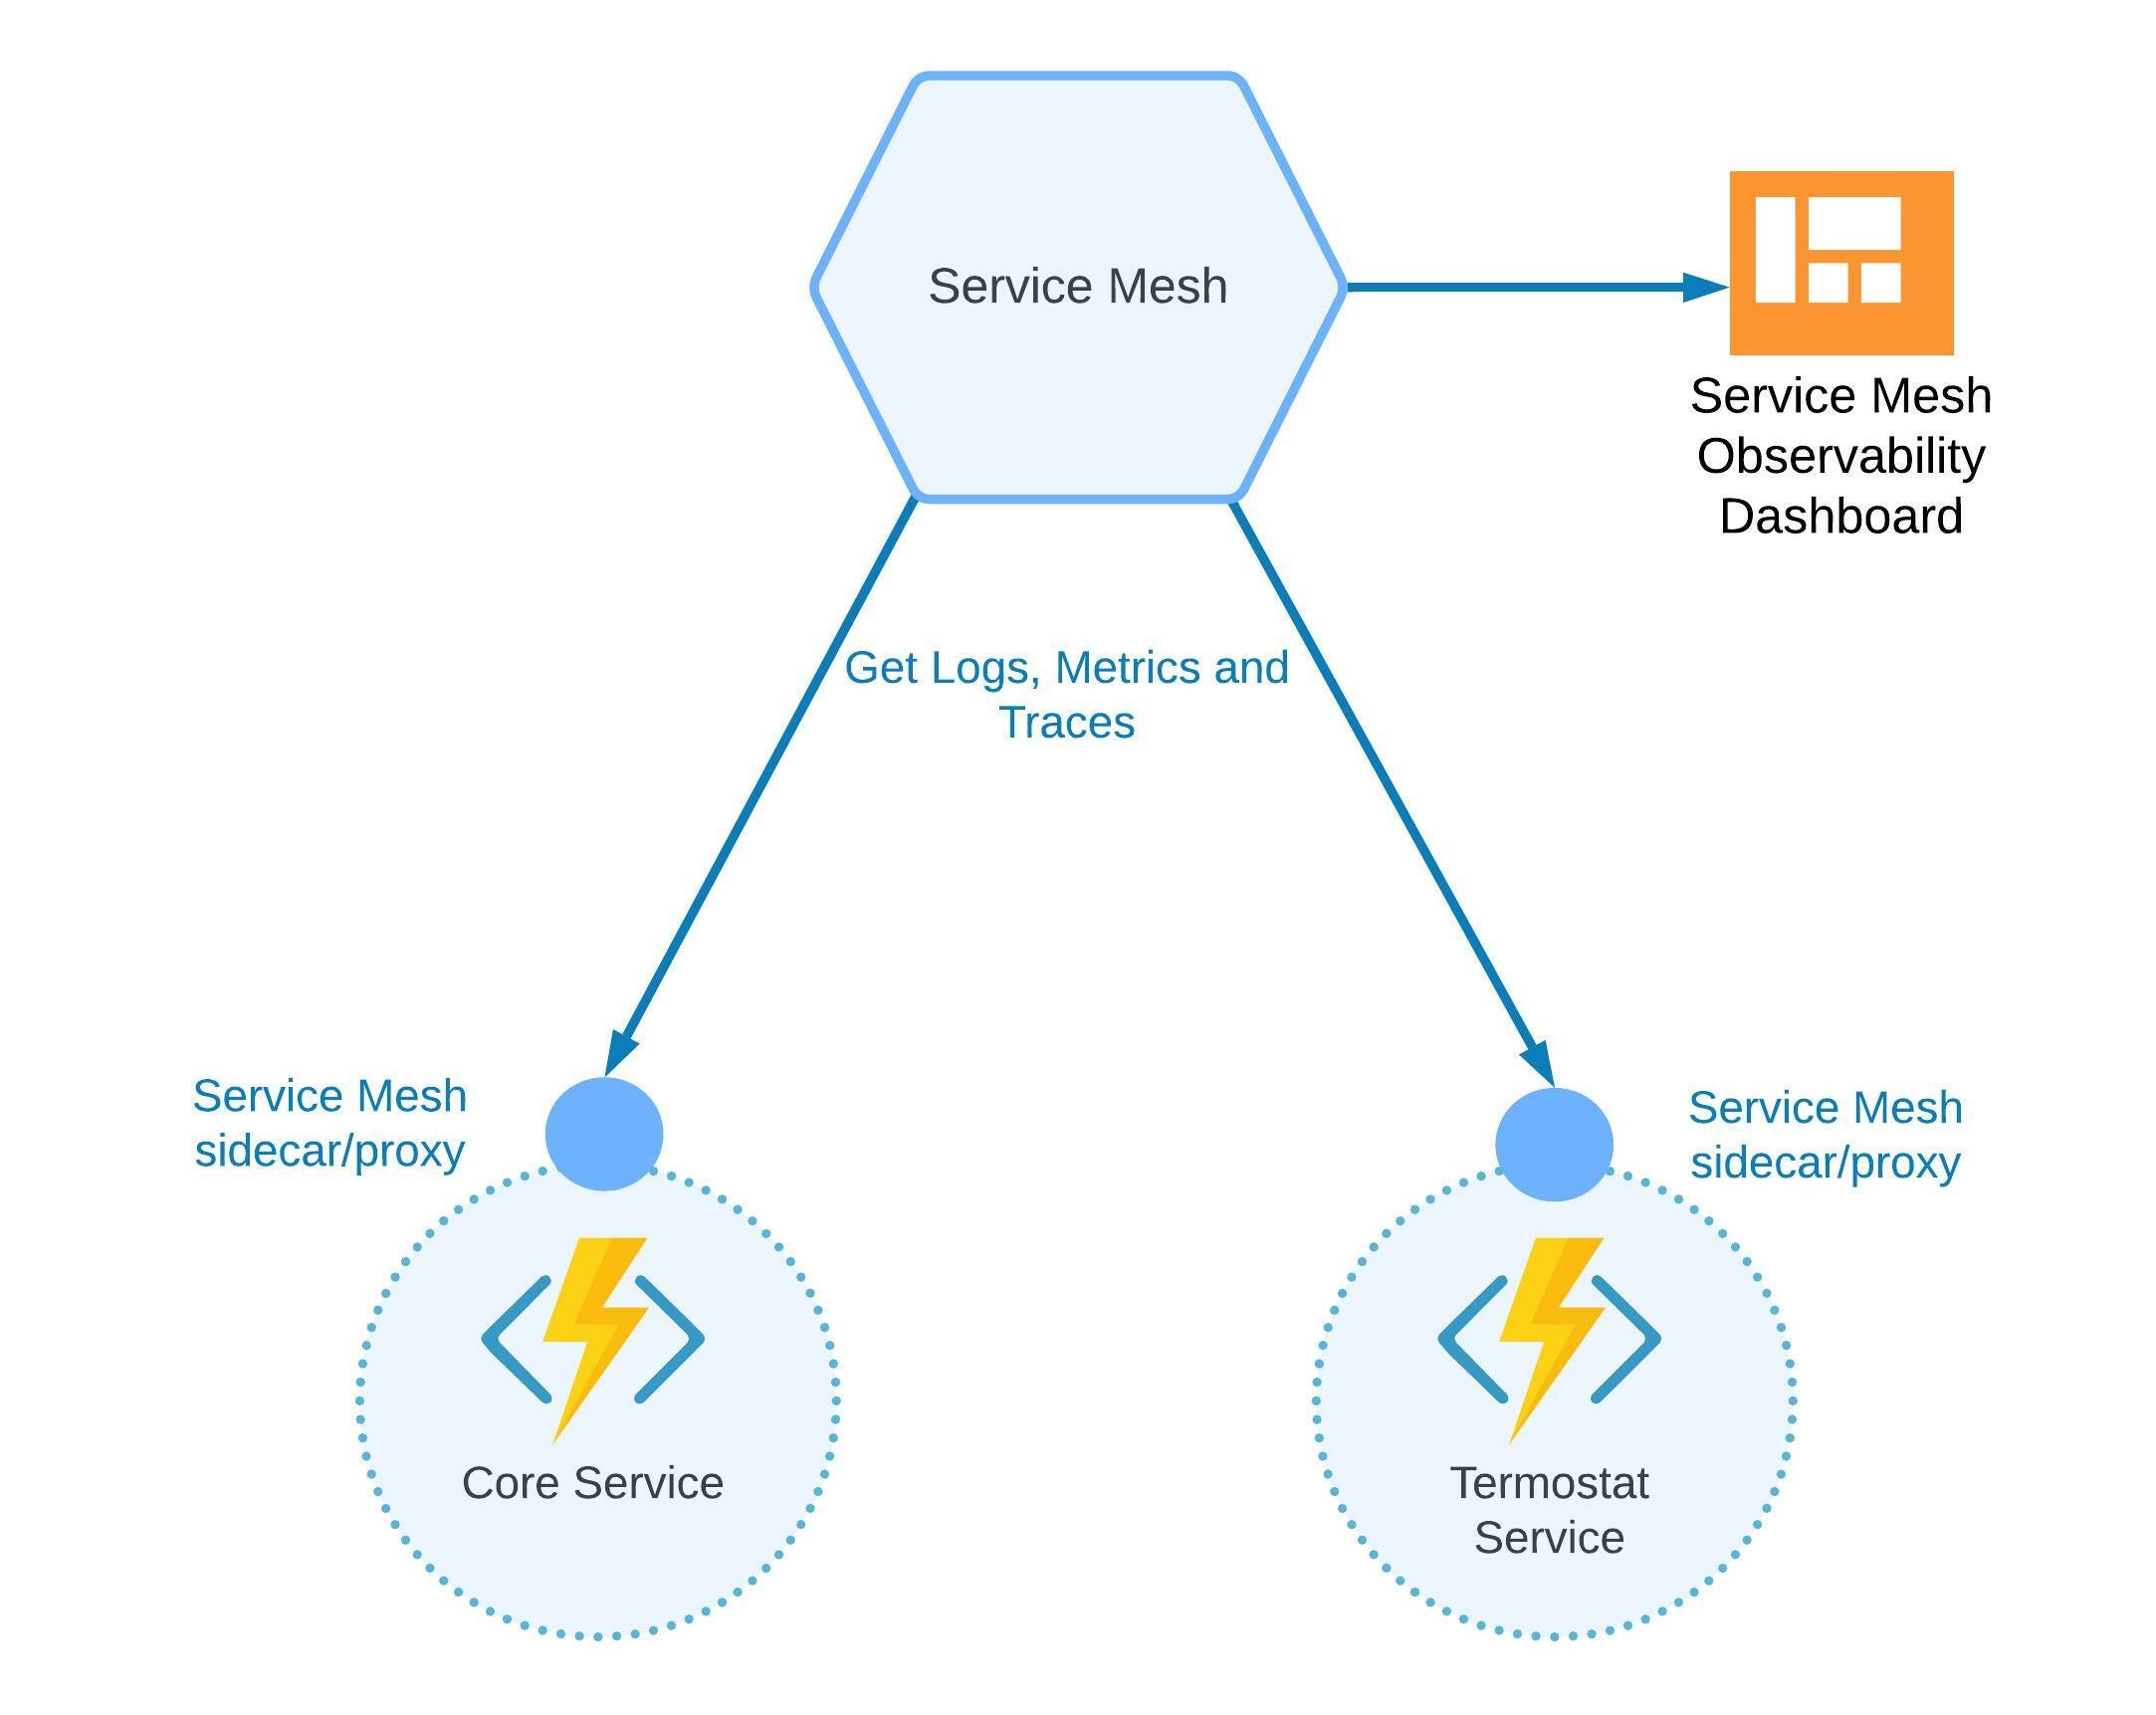
Figure 5: Service mesh as observability
Observability Architecture for Microservices
As an example of the observability architecture, I’m going to use a smart heating system. Smart heating is an essential part of each home (or even smart home) that allows owners to:
-
Manually manage heating in the apartment with an application.
-
Automatically adjust heating depending on time and the temperature outside and inside.
In addition, the system can do the following actions to help the owner:
-
Turn on/off the heating when people are about to arrive at the apartment.
-
Notify, alert, or just ask if something requires human attention or if something is wrong.
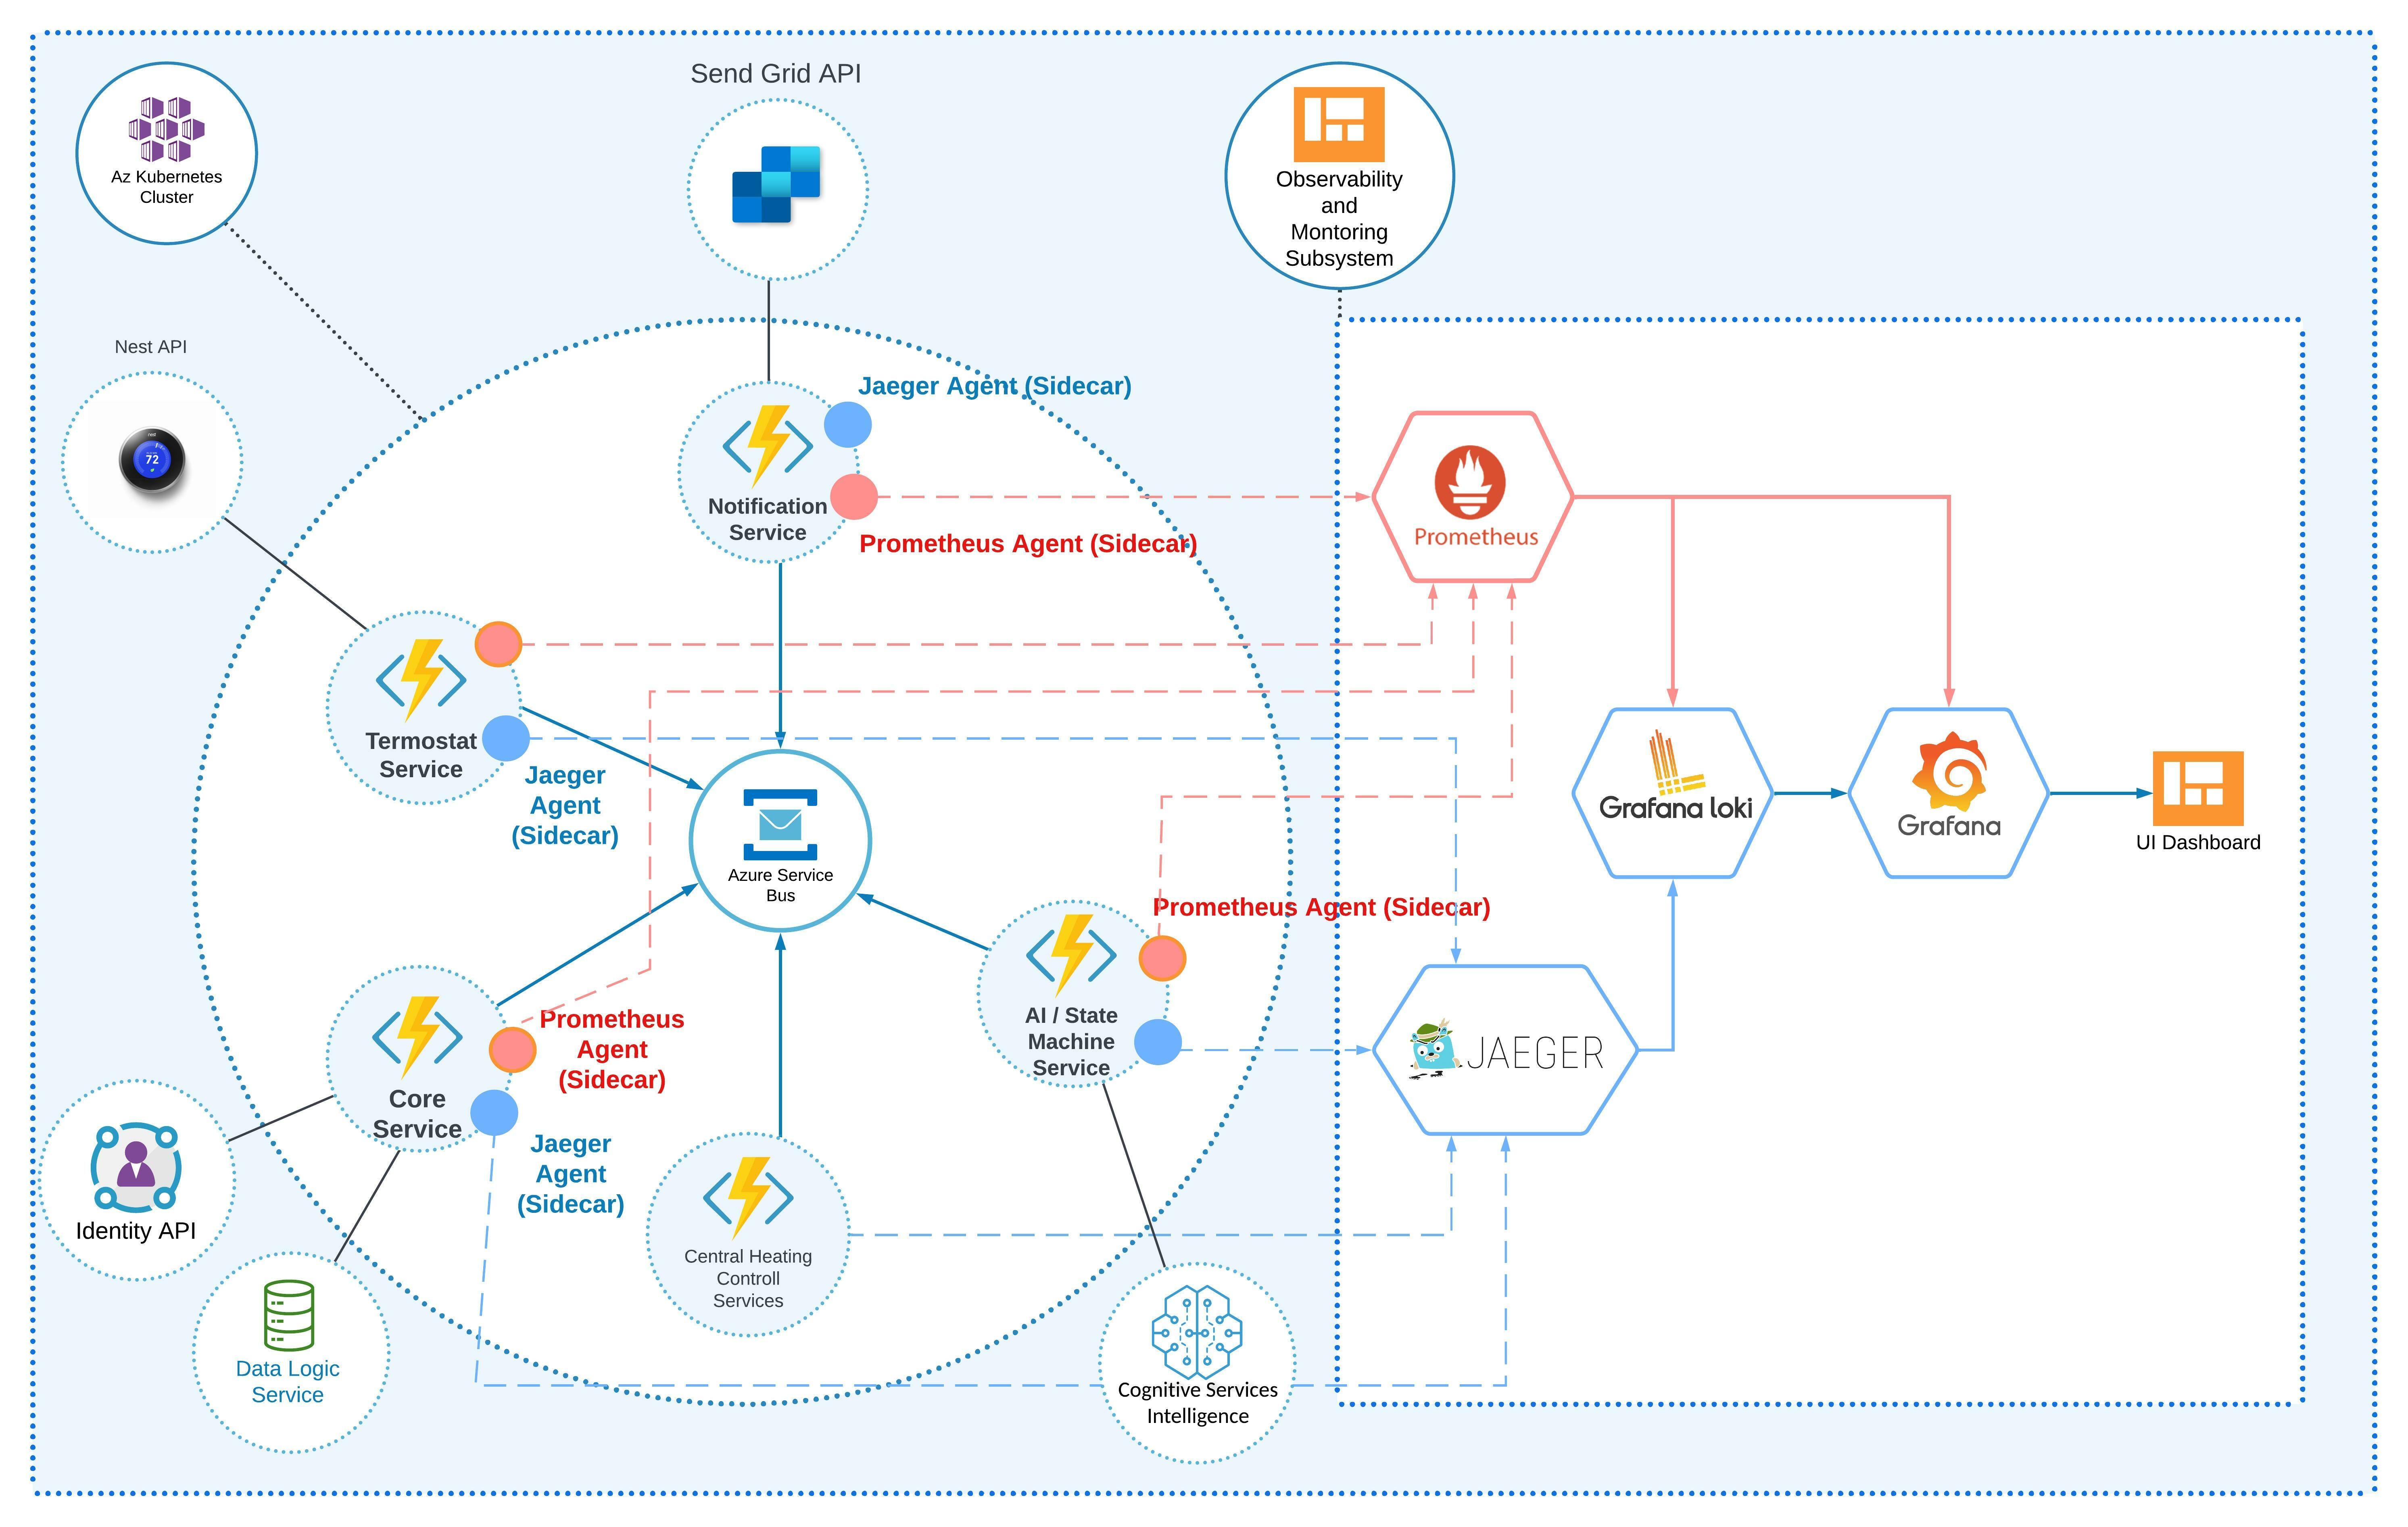
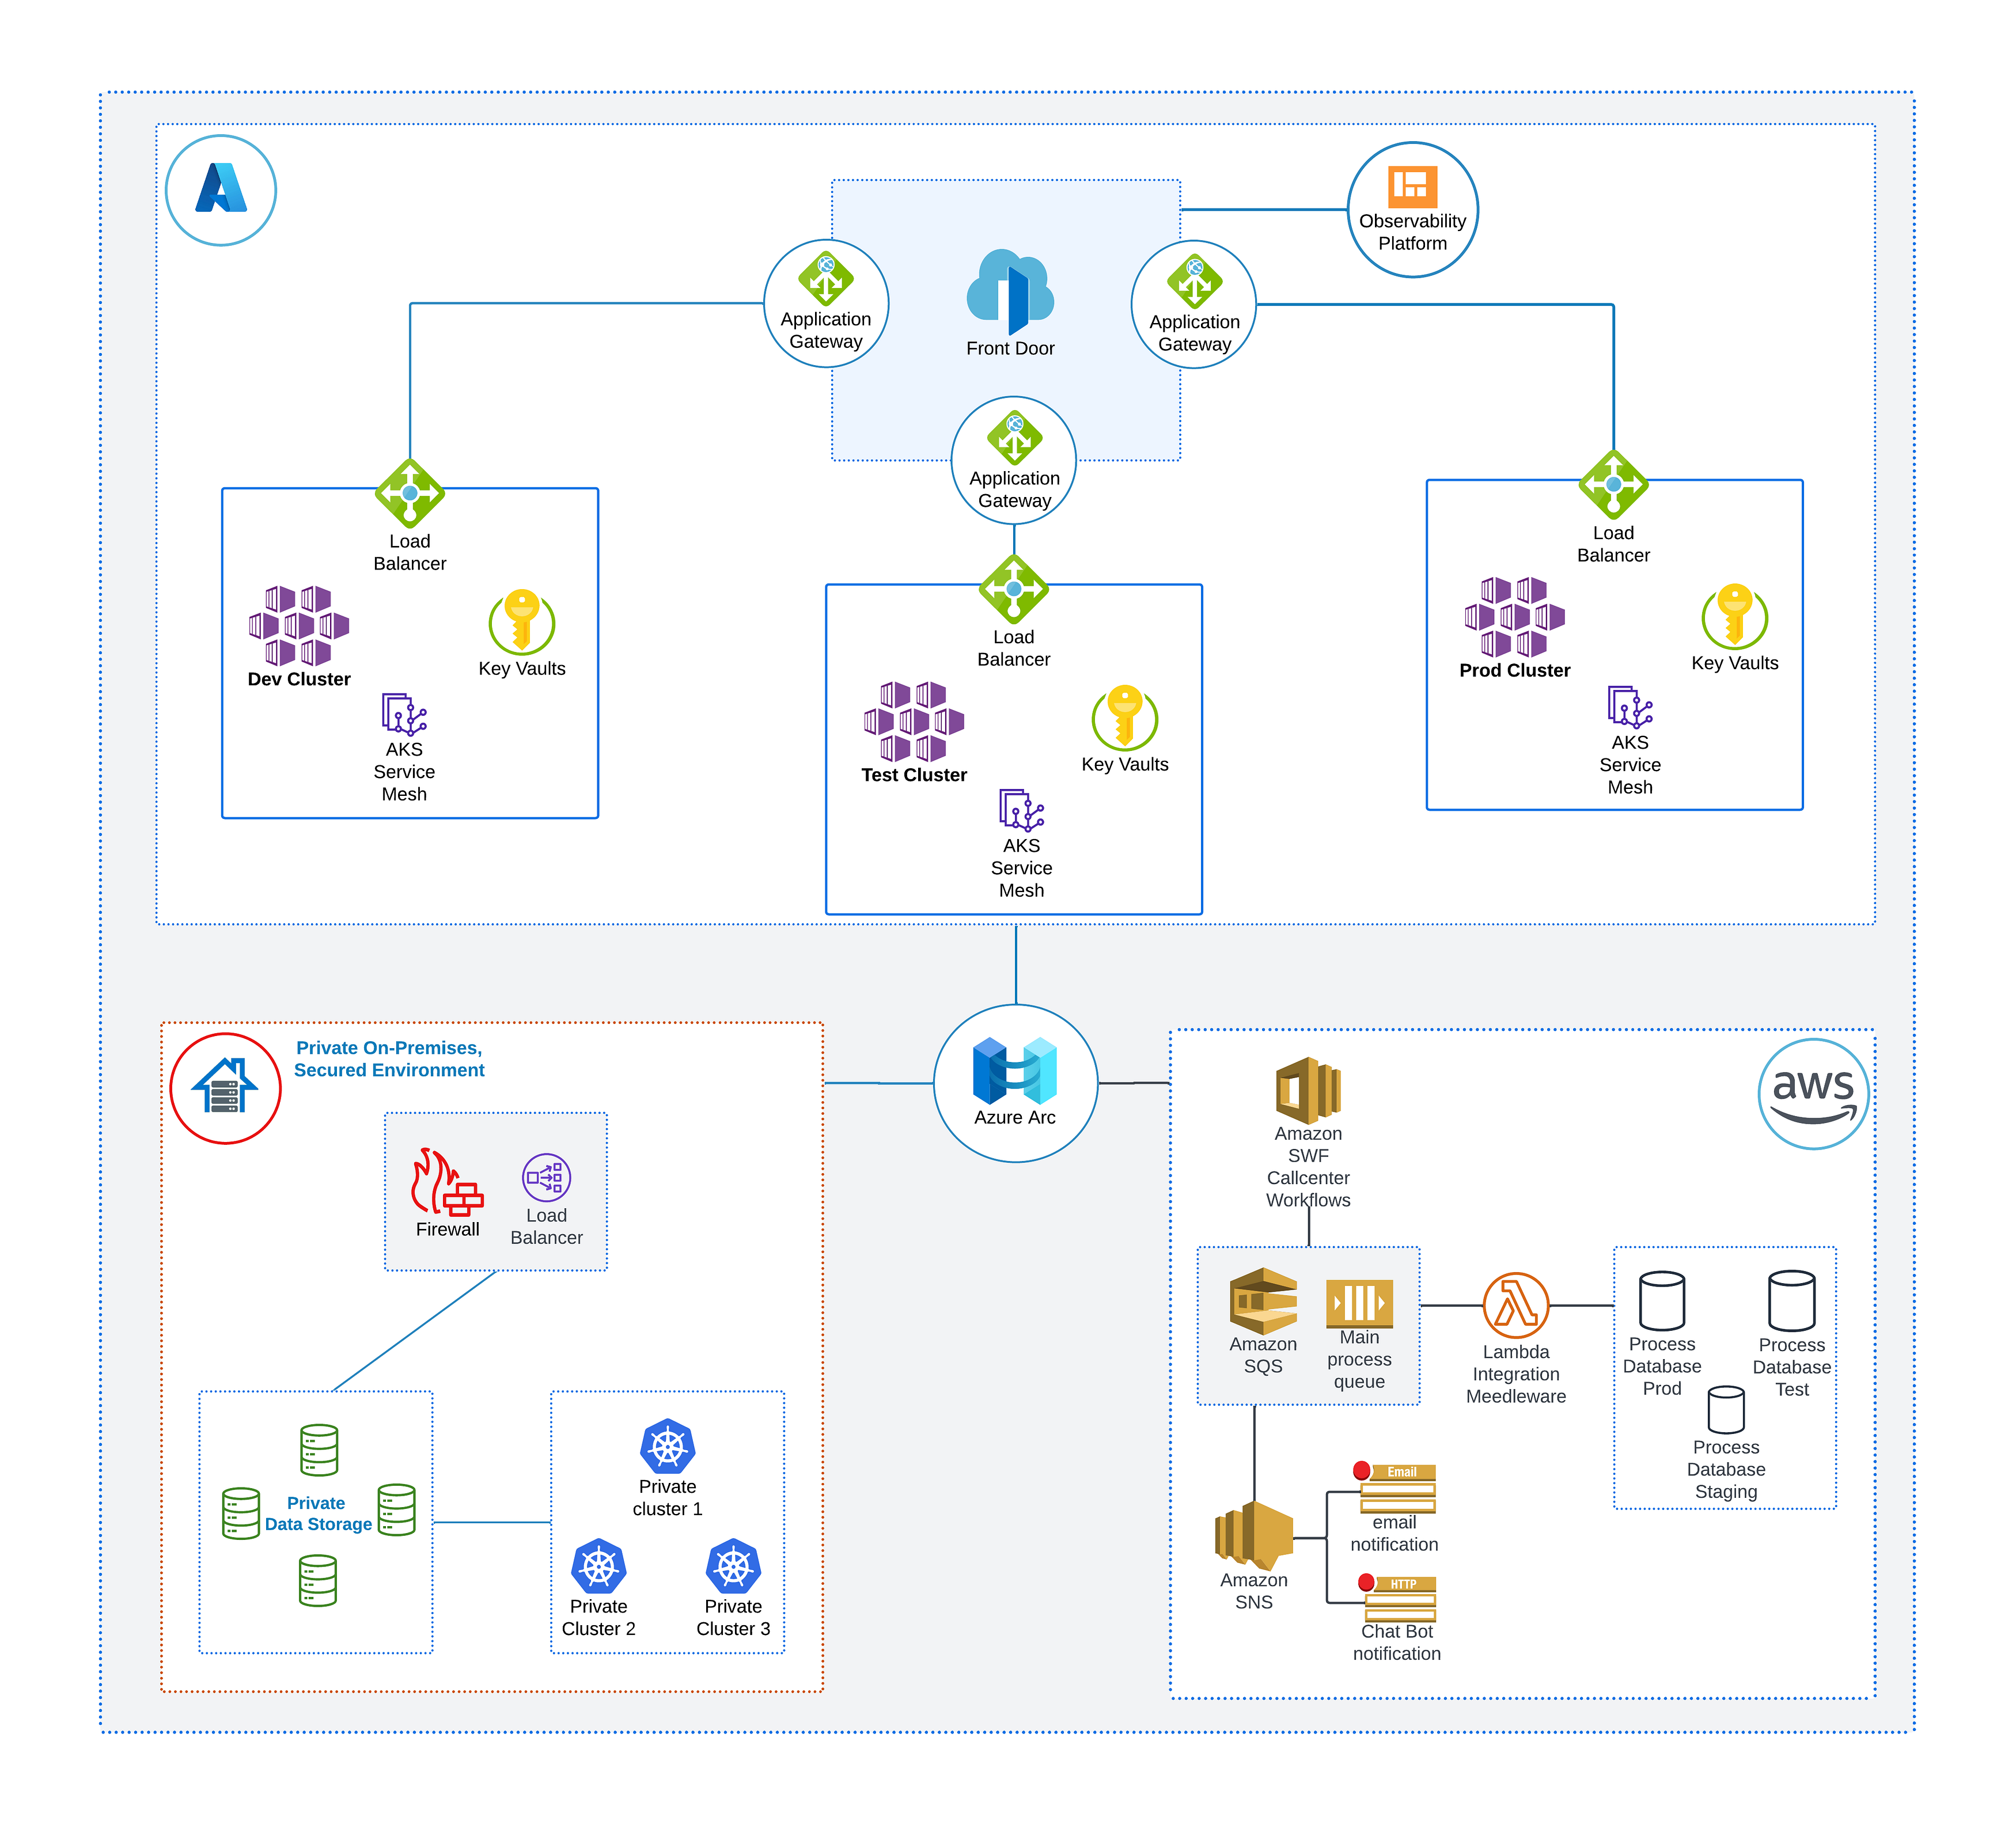
Figure 6: Microservices architecture with an observability subsystem
In Figure 6, you can see an architecture that is based on the microservices pattern, since it serves best and represents all system components. It contains main and observability subsystems. Each microservice is based on Azure Functions and deployed to the Azure Kubernetes Cluster. We deploy functions to Kubernetes using the KEDA framework. KEDA is an open-source, Kubernetes-based event autoscaling that allows us to automatically deploy and scale our microservices functions. Also, KEDA provides the tools to wrap functions to the Docker containers. We can also deploy microservices functions directly without KEDA and Kubernetes if we don’t have a massive load and don’t need the scaling options. The architecture contains the following components that represent the main subsystem:
- Azure operating as a microservice
- Azure Service Bus (or Azure IoT Hub) as a central messaging bus that microservices use to communicate
- Azure API Apps providing an API for mobile/desktop applications The essential part here is an observability subsystem. A variety of components and tools represent it. I’ve described all components in Table 1 below:
COMPONENTS OF THE OBSERVABILITY SYSTEM Tool Description Prometheus Prometheus is an open-source framework to collect and store logs and telemetry as time series data. Also, it provides alerting logic. Prometheus proxy or sidecar integrates with each microservice to collect all logs, telemetry, and tracing data. Grafana Loki Grafana Loki is an open-source distributed log aggregation service. It’s based on a labeling algorithm. It’s not indexing the logs; rather, it’s assigning labels to each log domain, subsystem, or category. Jaeger Jaeger is an open-source framework for distributed tracing in microservices-based systems. It also provides search and data visualization options. Some of the high-level use cases of Jaeger include:
- Performance and latency optimization
- Distributed transaction monitoring
- Service dependency analysis
- Distributed context propagation
- Root cause analysis
Grafana (Azure Managed Grafana) Grafana is also an open-source data visualization and analytics system. It allows the collection of traces, logs, and other telemetry data from different sources. We are using Grafana as a primary UI ΓÇ£control planeΓÇ¥ to build and visualize data dashboards that will come from Prometheus, Loki, and Grafana Loki sources.
Let’s summarize our observability architecture. Logging is covered by Prometheus and Grafana Loki, and distributed tracing is covered by Jaeger. All these components report to Grafana, which provides UI data dashboards, analytics, and alerts.
We can also use OpenTelemetry (OTel) framework. OTel is an open-source framework that was created, developed, and supported by the Cloud Native Computing Foundation (CNCF). The idea is to create a standardized vendor-free observability language specification, API, and tool. It is intended to collect, transform, and export telemetry data. Our architecture is based on the Azure cloud, and we can enable OpenTelemetry for our infrastructure and application components. Below you can see how our architecture can change with OpenTelemetry.
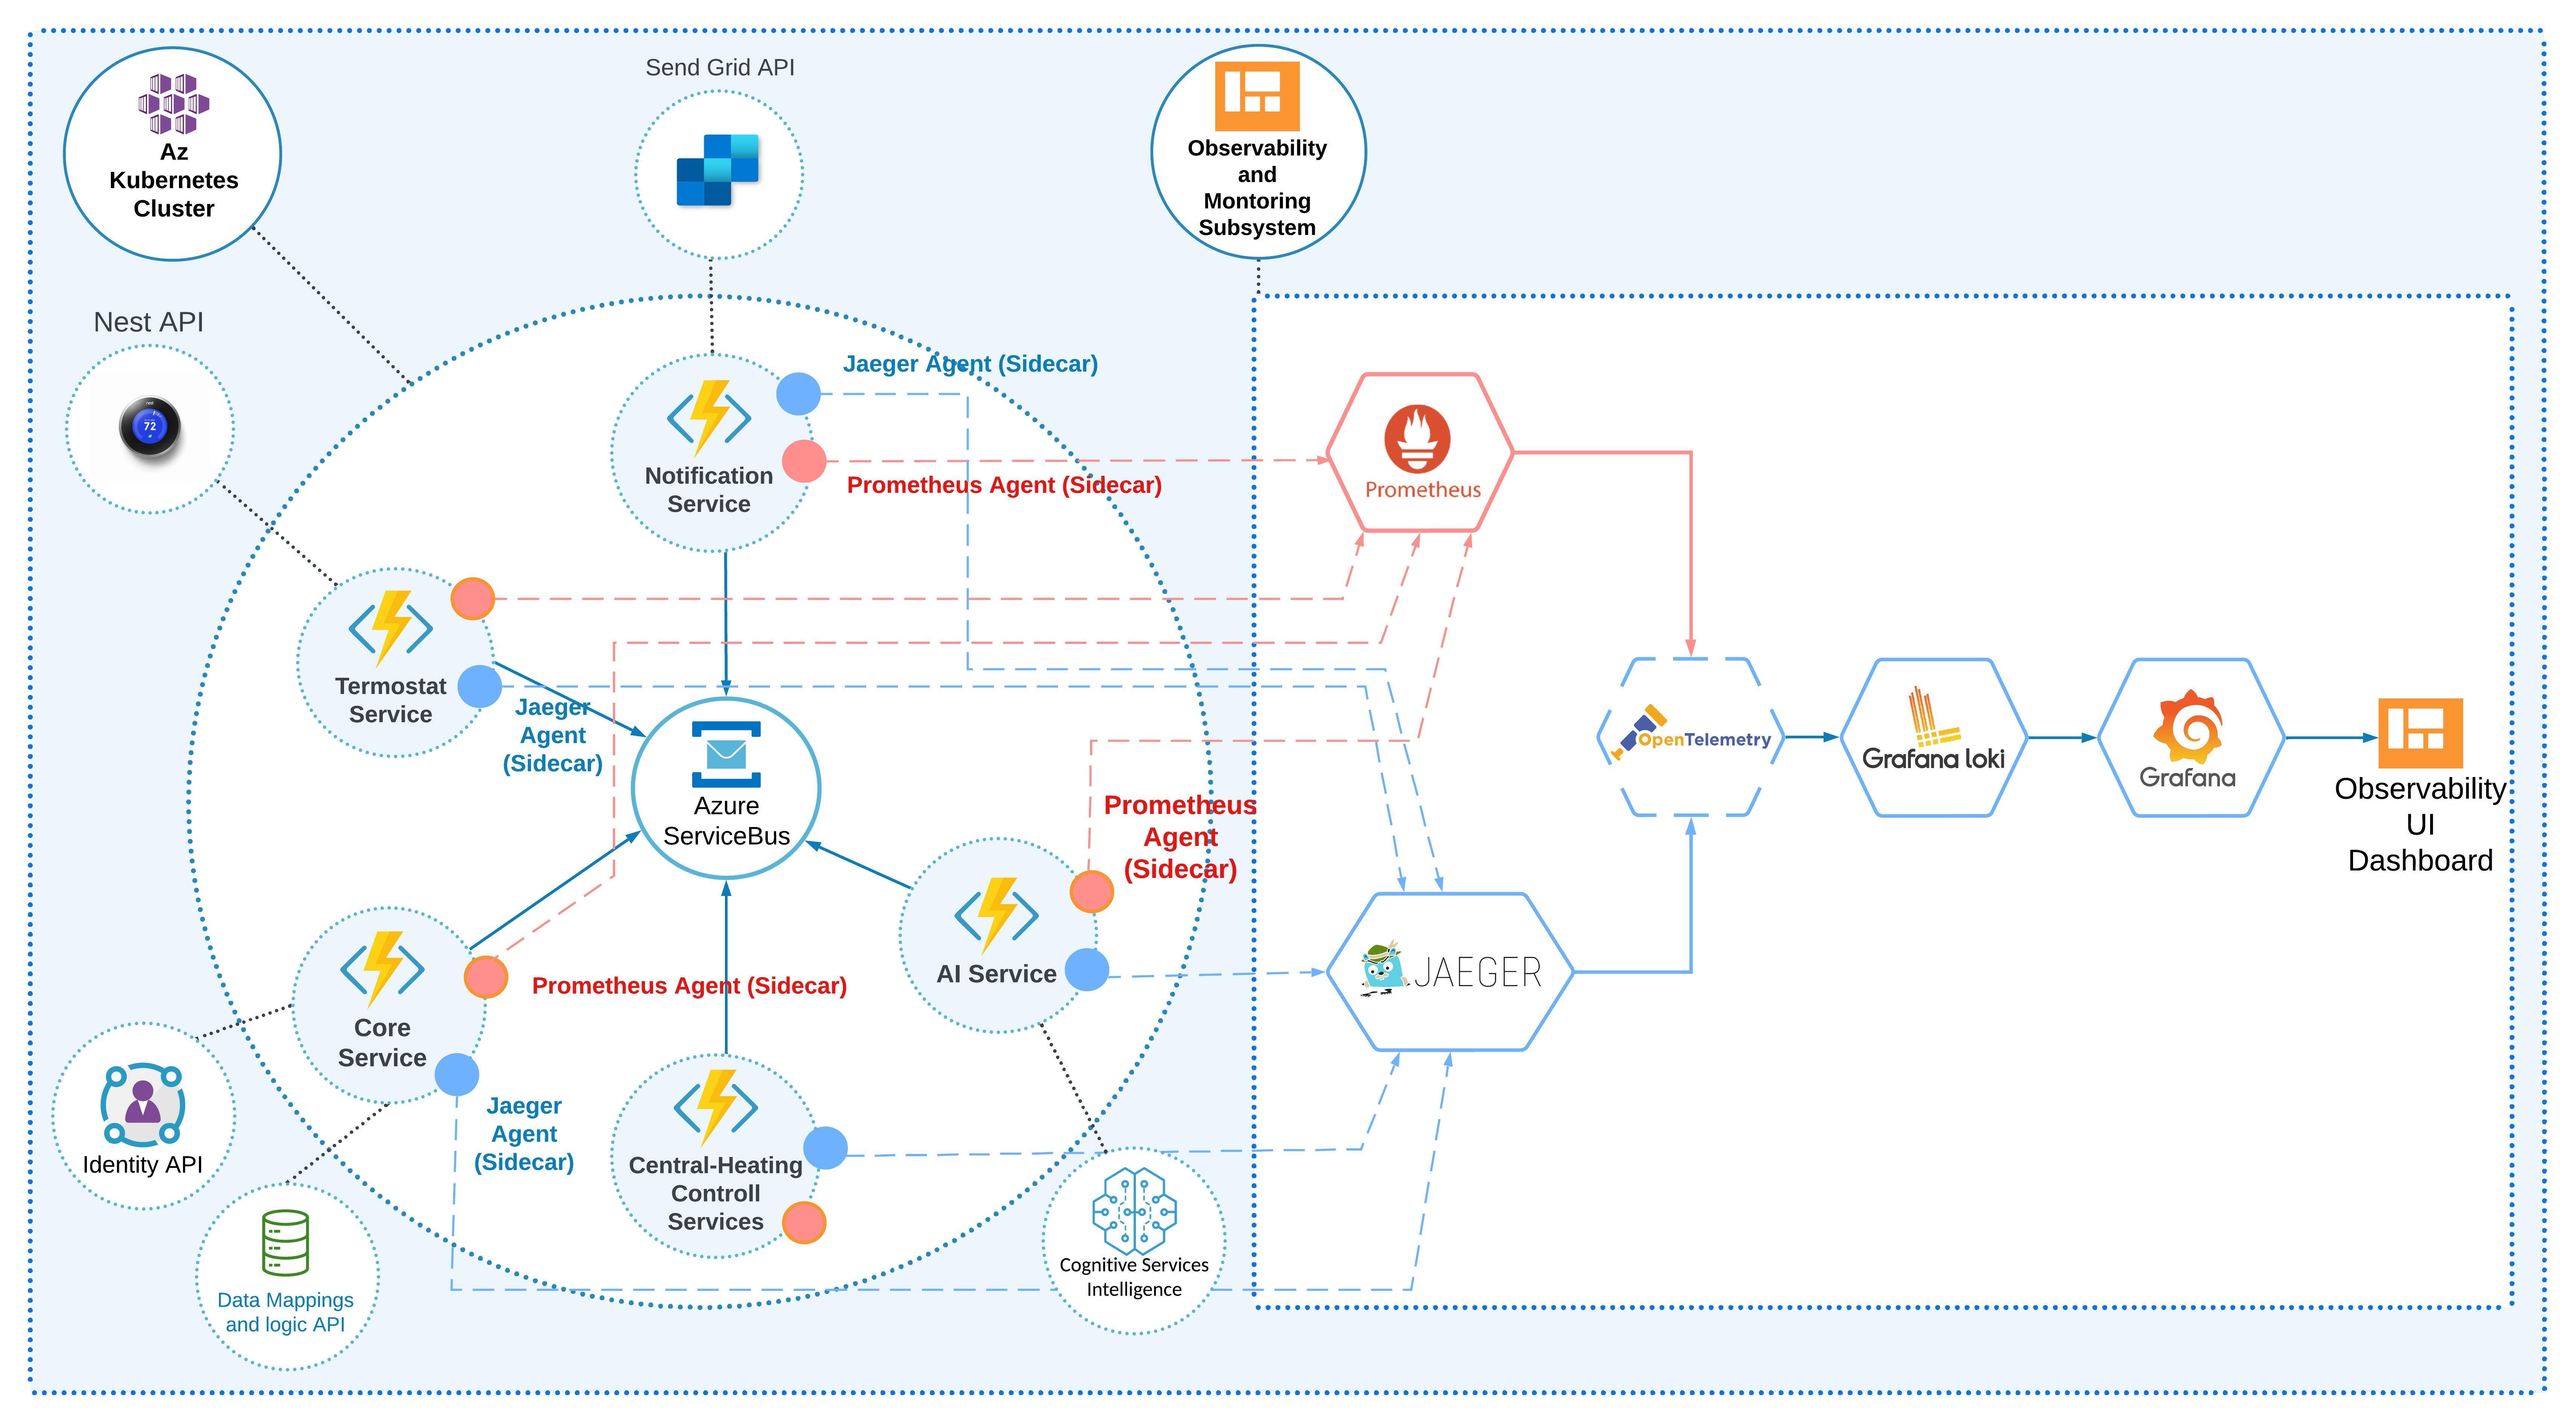
Figure 7: Smart heating with an observability subsystem and OpenTelemetry
It is also worth mentioning that we do not necessarily need to add OTel, as it may add additional complexity to the system. In the figure above, you can see that we need to forward all logs from Prometheus to OTel. Also, we can use Jaeger as a backend service for OTel. Grafana Loki and Grafana will get data from OTel.
Conclusion
In this article, we demystified observability and monitoring terms, and we walked through examples of microservices architecture with observability subsystems that can be used not only with Azure but also with other cloud providers. Also, we defined the main difference between monitoring and observability, and we walked through essential monitoring and observability patterns and toolsets. Developers and architects should understand that an observability/monitoring platform is a tooling or a technical solution that allows teams to actively debug their system.
This is an article from DZone’s 2022 Performance and Site Reliability Trend Report. For more: Read the Report

Comments